DeepUMQA-X server information
Overview of DeepUMQA-X server
The DeepUMQA-X server is a web-based platform for model quality assessment of protein single-chain and complex structure.
Figure 1 shows the pipeline of DeepUMQA-X.
For the input of protein models, we first use DeepUMQAS and GraphCPLMQA2 (Local version, See Figure 2 for details.) to predict the TM-score and per-residue lDDT for each model.
Next, the models are ranked based on these scores to select high-quality candidate models.
Finally, structural alignment between the candidate models and all models is performed to refine the predictions of TM-score (SCORE), QS-score (QSCORE), and per-residue lDDT (Local).
In the process of structural alignment, for large complexes and massive complex models,
we use a lightweight structural alignment method, Interface Sequence Align (Figure 1B). For the input protein model,
we use an inter-chain contact threshold (8Å) to extract the interface structure and obtain the corresponding residue sequence from it,
where the missing part of the structure uses gaps to represent the corresponding residues.
Finally, the interface residue sequences of all models are collected to predict the quality scores of the models by sequence consensus.
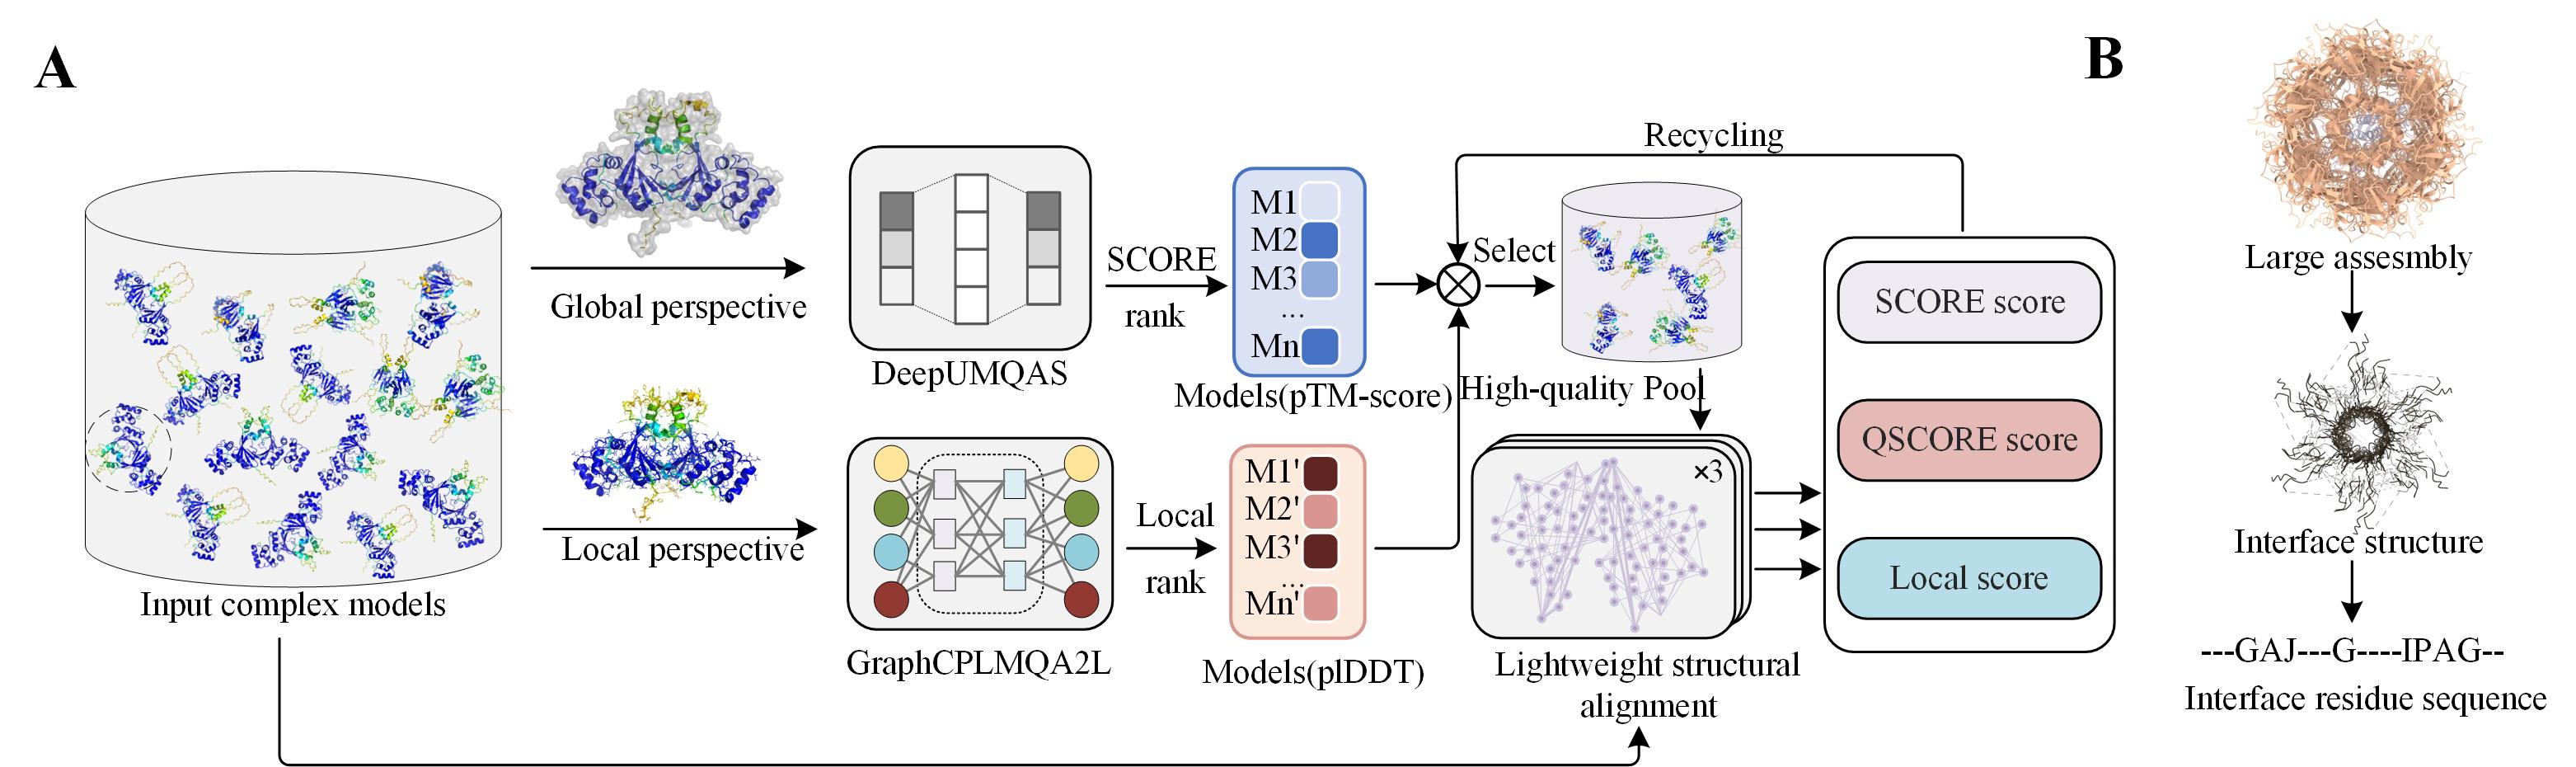
Figure 1. Overview of DeepUMQA-X for model quality assessment of protein single-chain and complex structure.
Overview of GraphCPLMQA2
GraphCPLMQA2 is an important component of DeepUMQA-X, which includes GraphCPLMQA2L, GraphCPLMQA2S and GraphCPLMQA2Q (only complex) for evaluating the global quality, local quality and interface quality of protein models, respectively.
Based on GraphCPLMQA (version 1), these methods newly introduce Evoformer features from AlphaFold2 and improve the architecture of graph neural networks for different metrics of protein models.
Figure 2 shows the pipeline of GraphCPLMQA2. For the input of protein models, GraphCPLMQA2 extracts the structural, sequence, evolutionary, and statistical features of the model respectively, and inputs them into the graph neural network to predict the true structure.
Then, the representation of the prediction structure is combined with the features of the protein model and input into the residue neural network to obtain a representation of the difference between the predicted and true structures.
Further, this representation is input into the Error-block and cutoff-block to predict the distance error and contact map respectively.
Then, in the fusion-block, these maps are combined with the features of the protein model to obtain a fused representation.
Finally, this fused representation is input into the separately trained neural network block to predict the quality score for the metrics lDDT, TM-score, and QS-score.
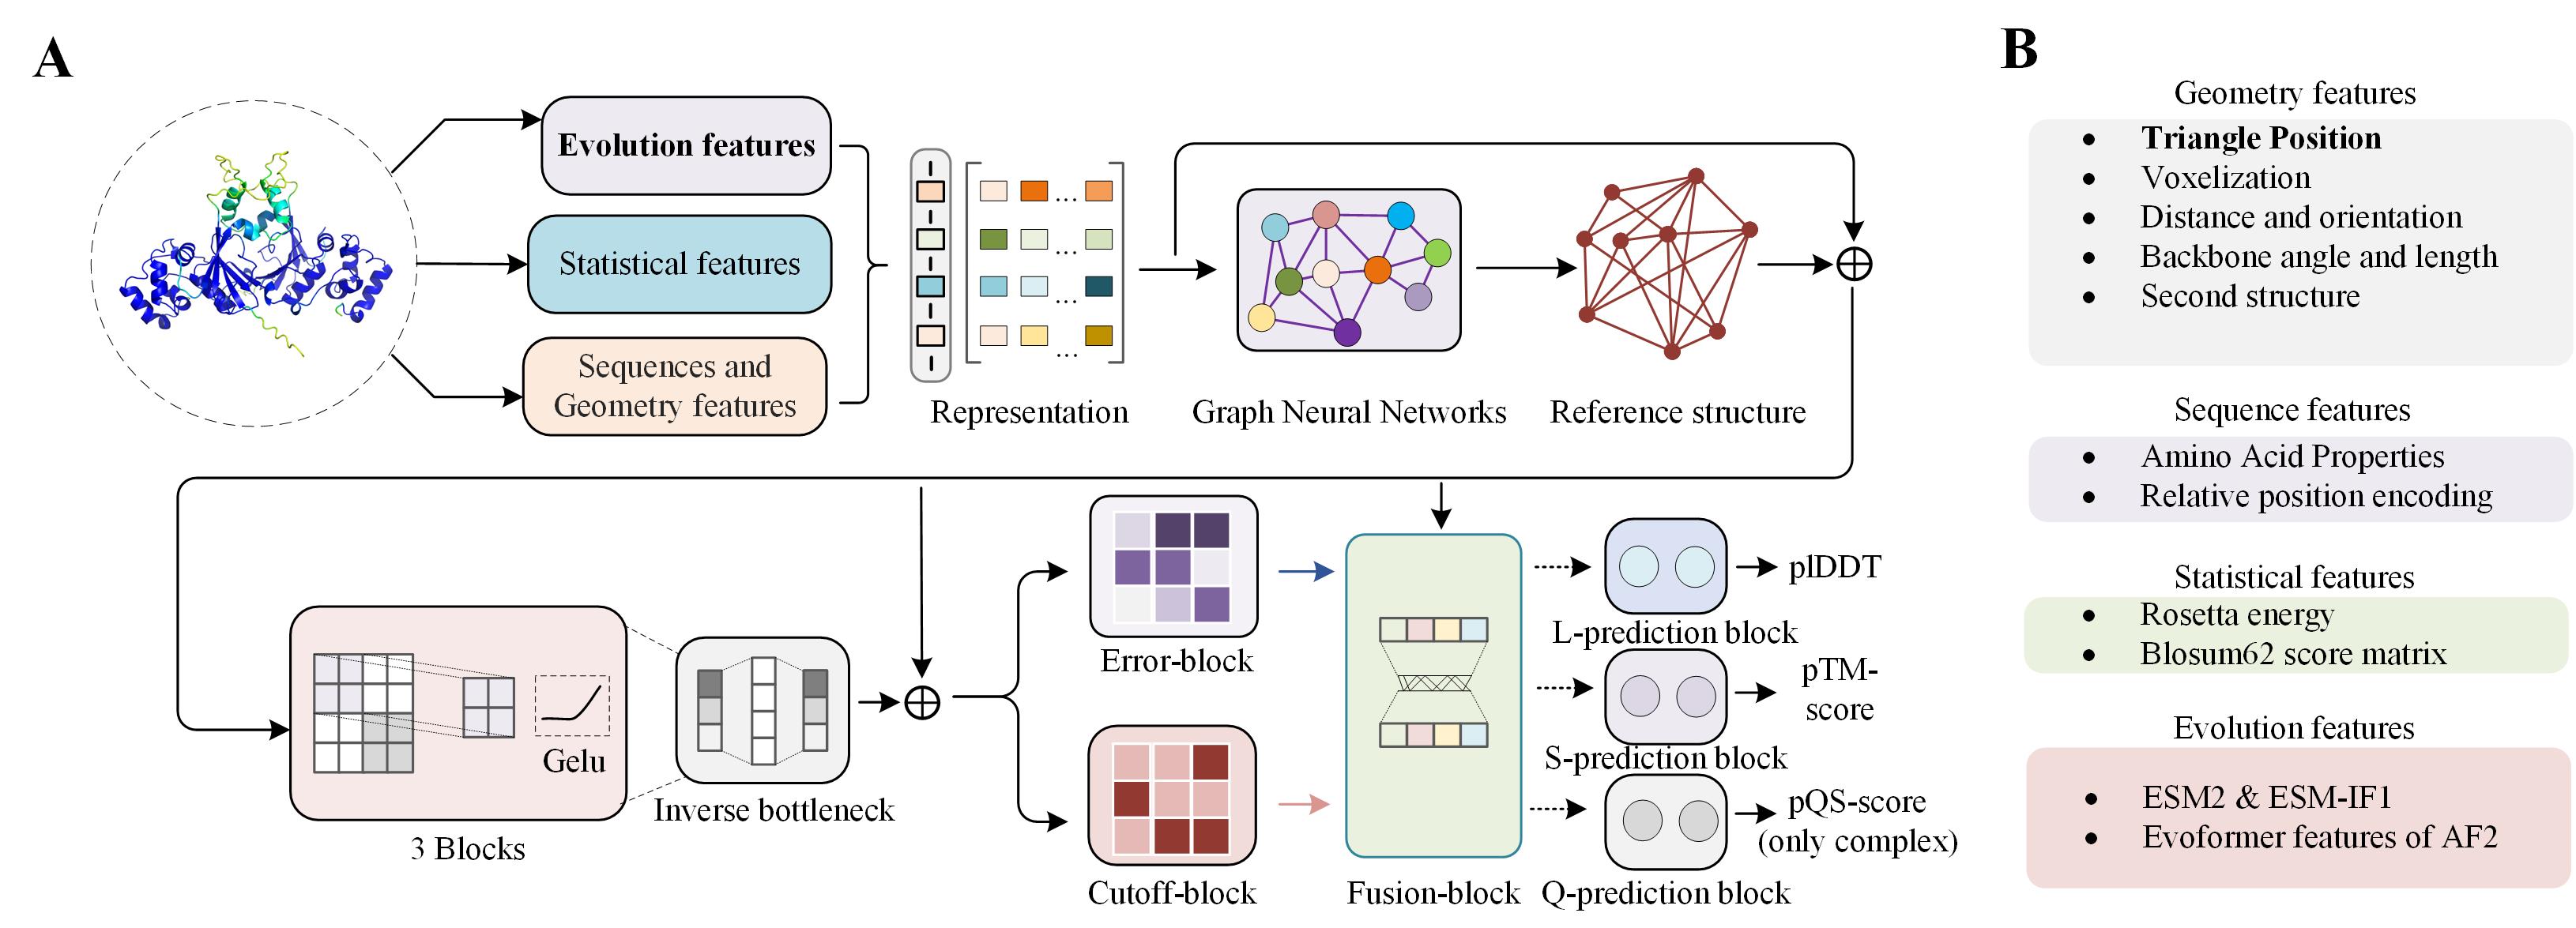 Figure 2. Overview of GraphCPLMQA2 for model quality assessment of protein single-chain and complex structure.
Performance of DeepUMQA-X in the EMA blind test of CASP16
In the EMA blind test of CASP16, DeepUMQA-X (Group name: GuijunLab-QA & GuijunLab-Human) ranked
third in complex local interface accuracy estimation (Local),
third in complex local interface residue identification,
third in overall interface accuracy estimation (QSCORE, excluding AC Baseline),
fifth in overall fold accuracy estimation (SCORE, excluding AC Baseline),
fourth in performance of heterology complex model selection,
fourth in per-atom accuracy assessment,
and second in per-residue accuracy assessment.
In addition, for the performance comparison of single-model methods
only (excluding quasi-single-model methods and methods that use input structural consensus information),
GraphCPLMQA2 ranked first in complex local interface accuracy estimation (Local),
first in overall interface accuracy estimation (QSCORE),
first in overall fold accuracy estimation (SCORE),
first in performance of homologous complex model selection,
and fifth in performance of heterology complex model selection.
The results are cited from https://predictioncenter.org/casp16/zscores_EMA.cgi.
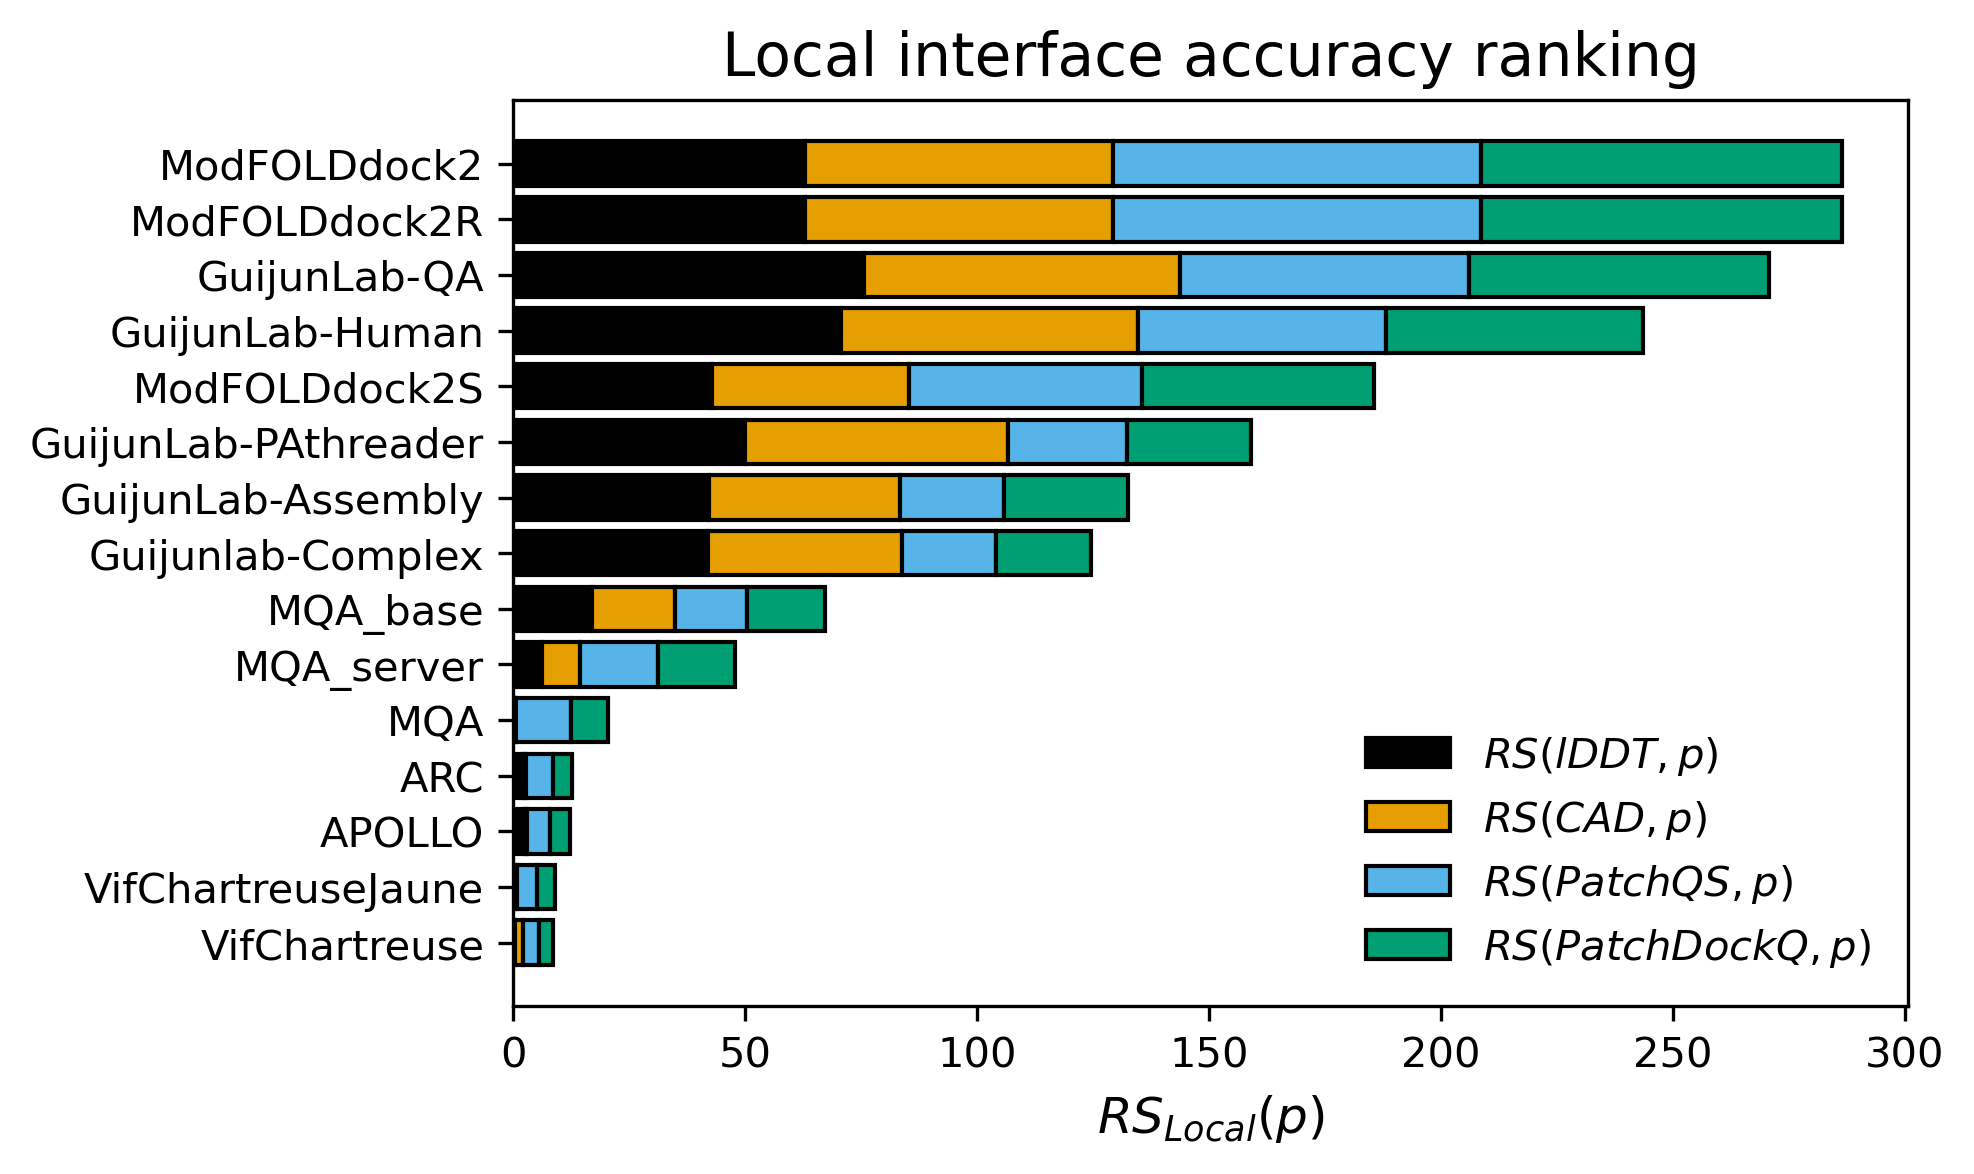
Figure 3. Z-score ranking of Local interface residue accuracy estimation.

Figure 4. ROC AUC of Local interface residue accuracy identification.
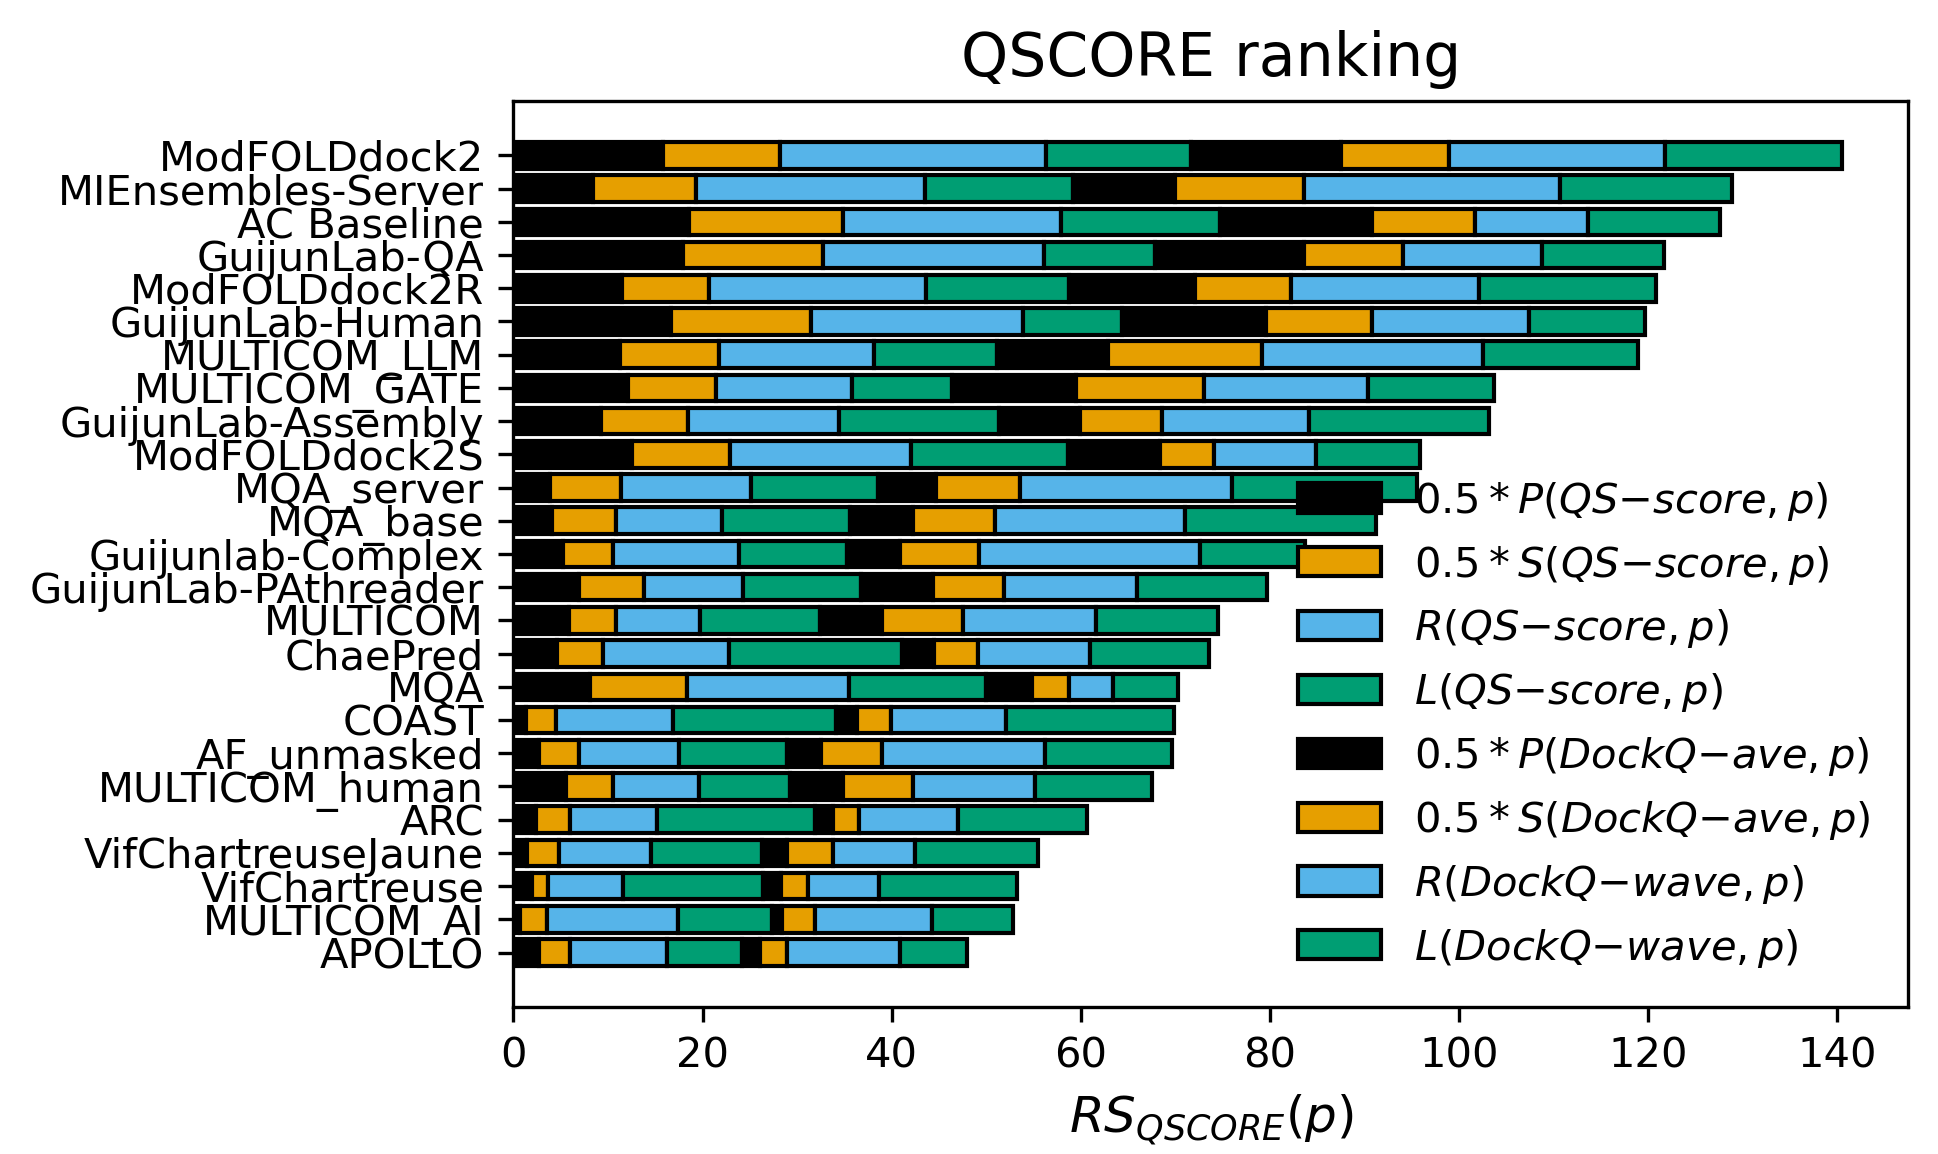
Figure 5. Z-score ranking of overall interface accuracy estimation.
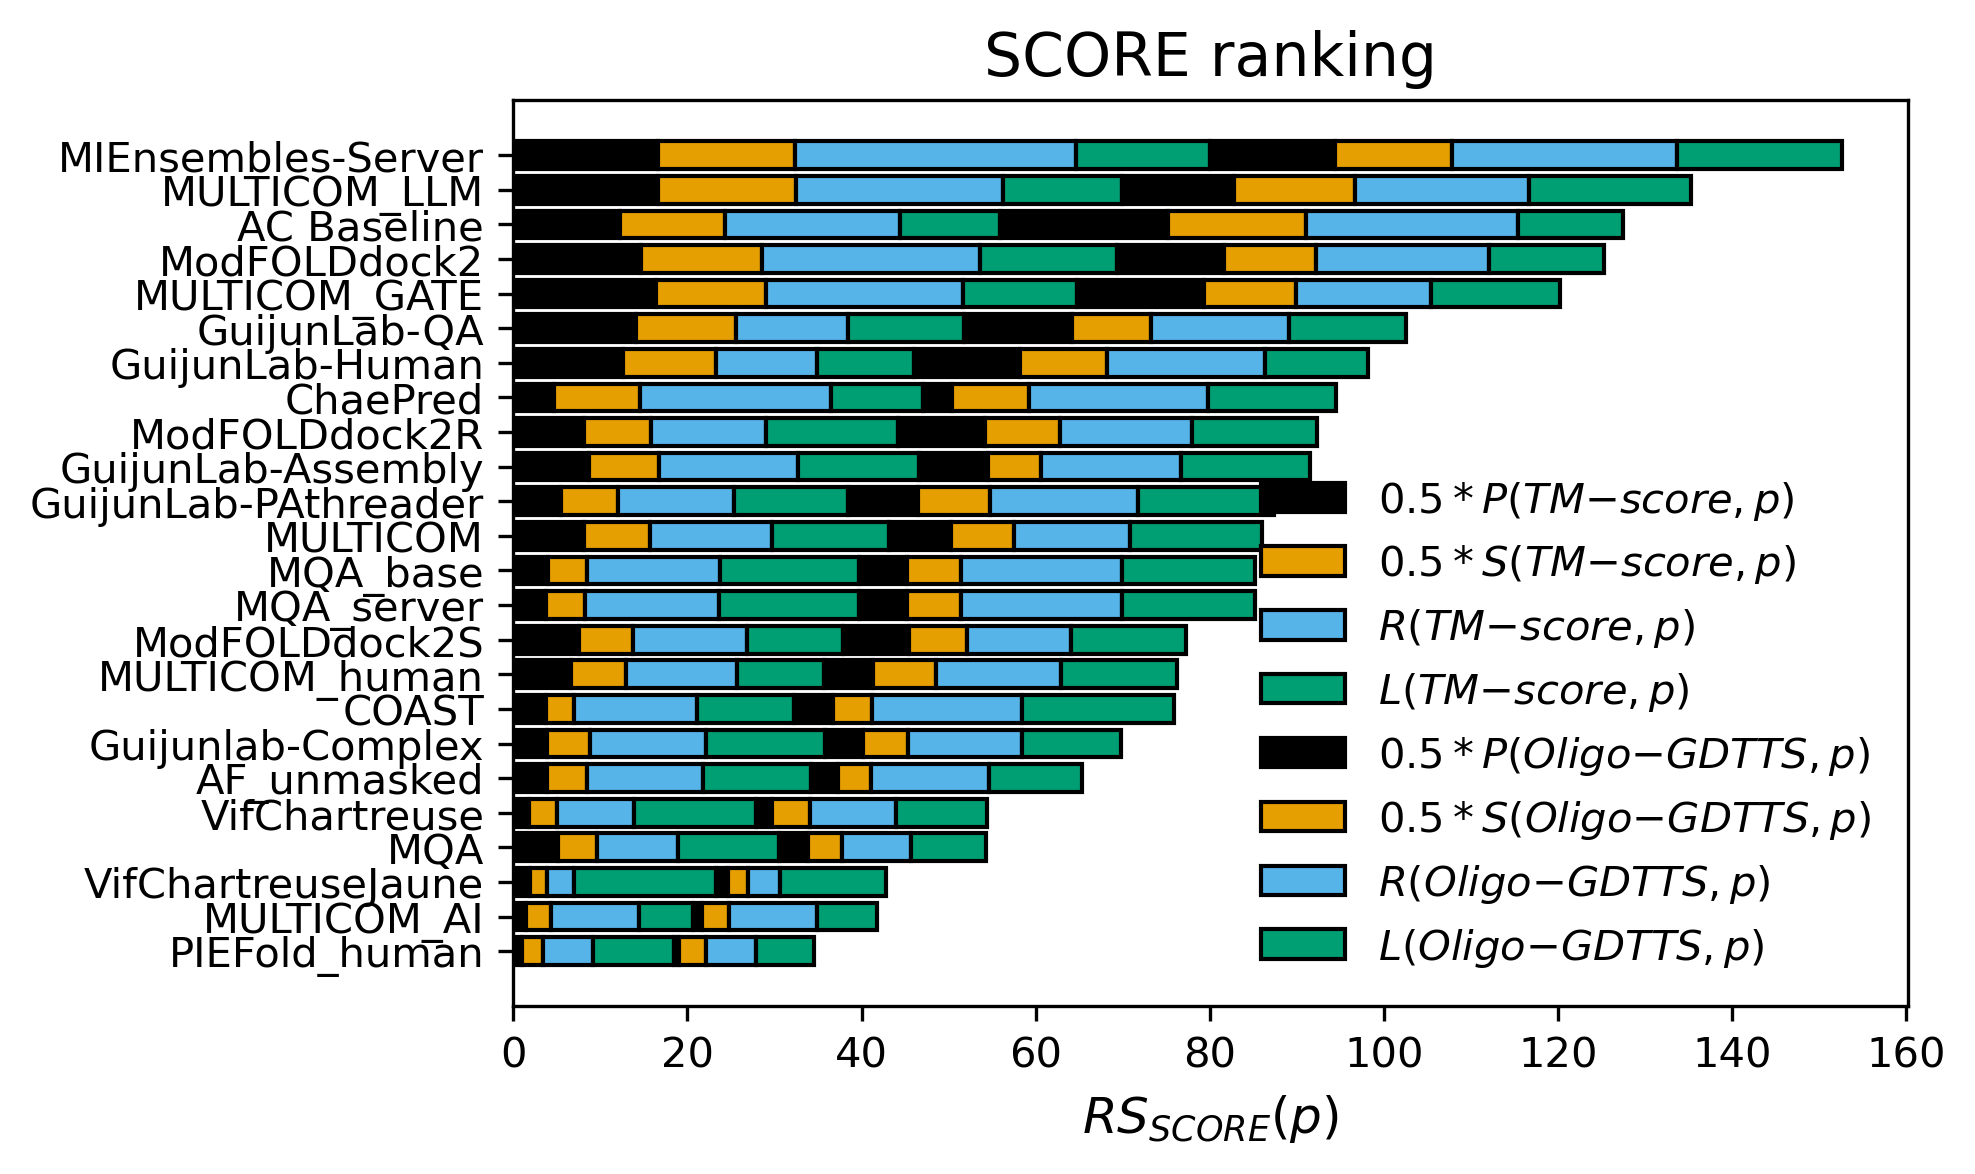
Figure 6. Z-score ranking of overall fold accuracy estimation.

Figure 7. per-atom accuracy assessment.
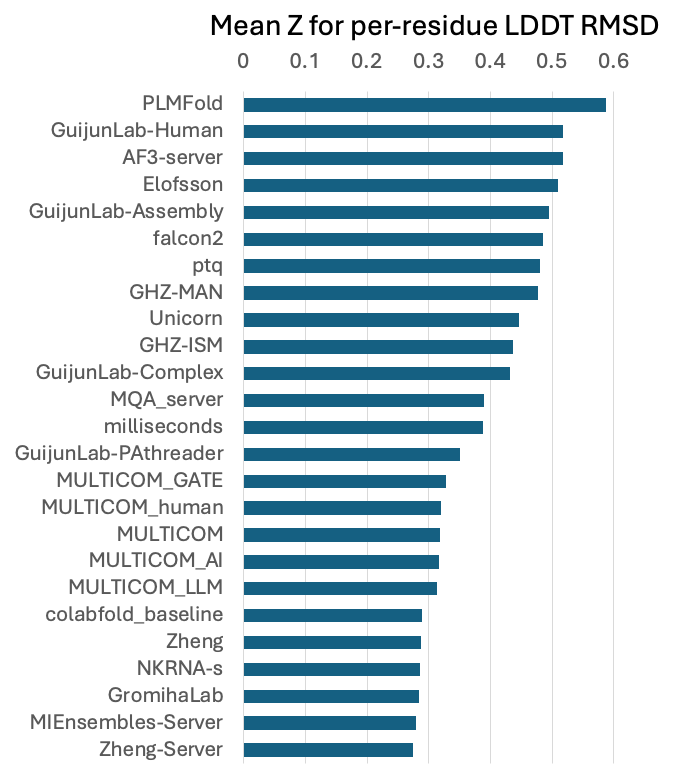
Figure 8. per-residue accuracy assessment.
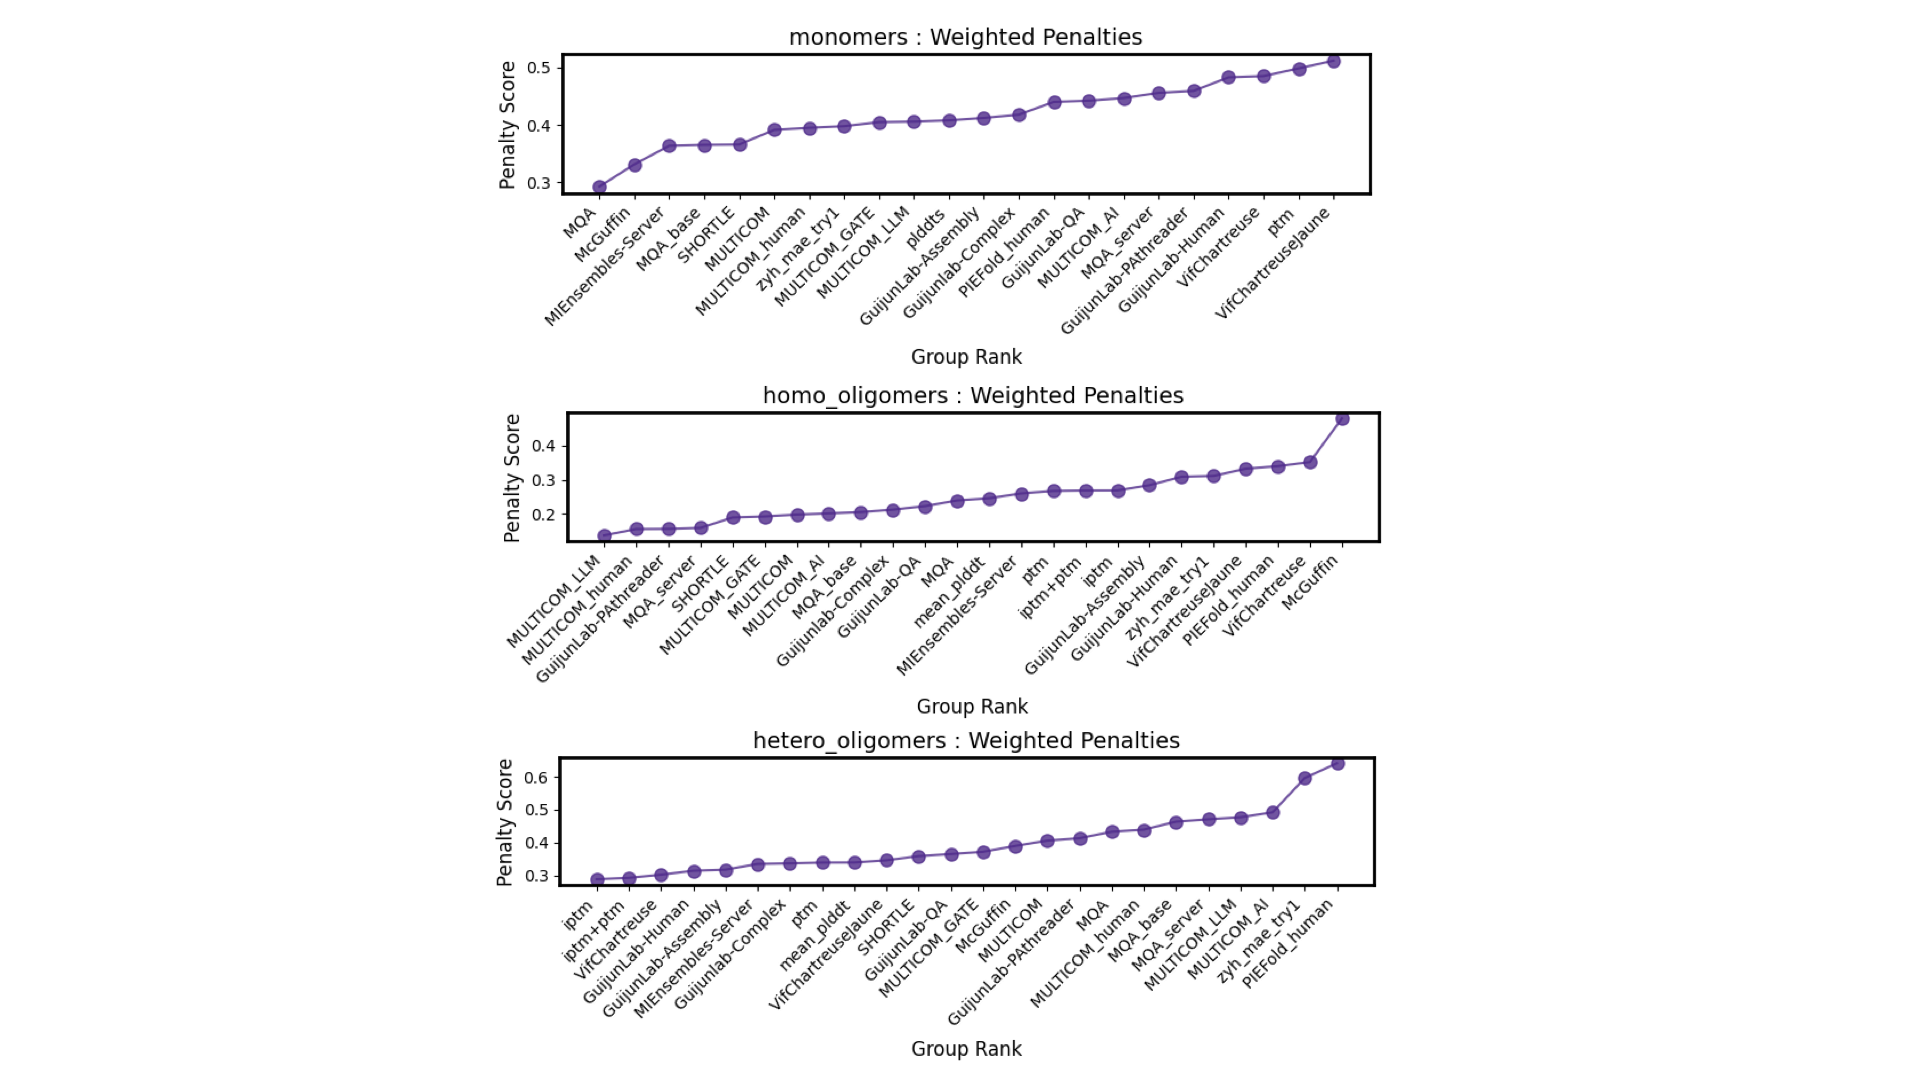 Figure 9. performance of complex model selection
Performance of GraphCPLMQA in the CAMEO-QE blind test
In the CAMEO-QE blind test, GraphCPLMQA ranked first in the 1-year (2023-06-09 to 2024-06-01) model quality assessment for low, medium, high and all dataset.The results are cited from https://www.cameo3d.org/quality-estimation/.
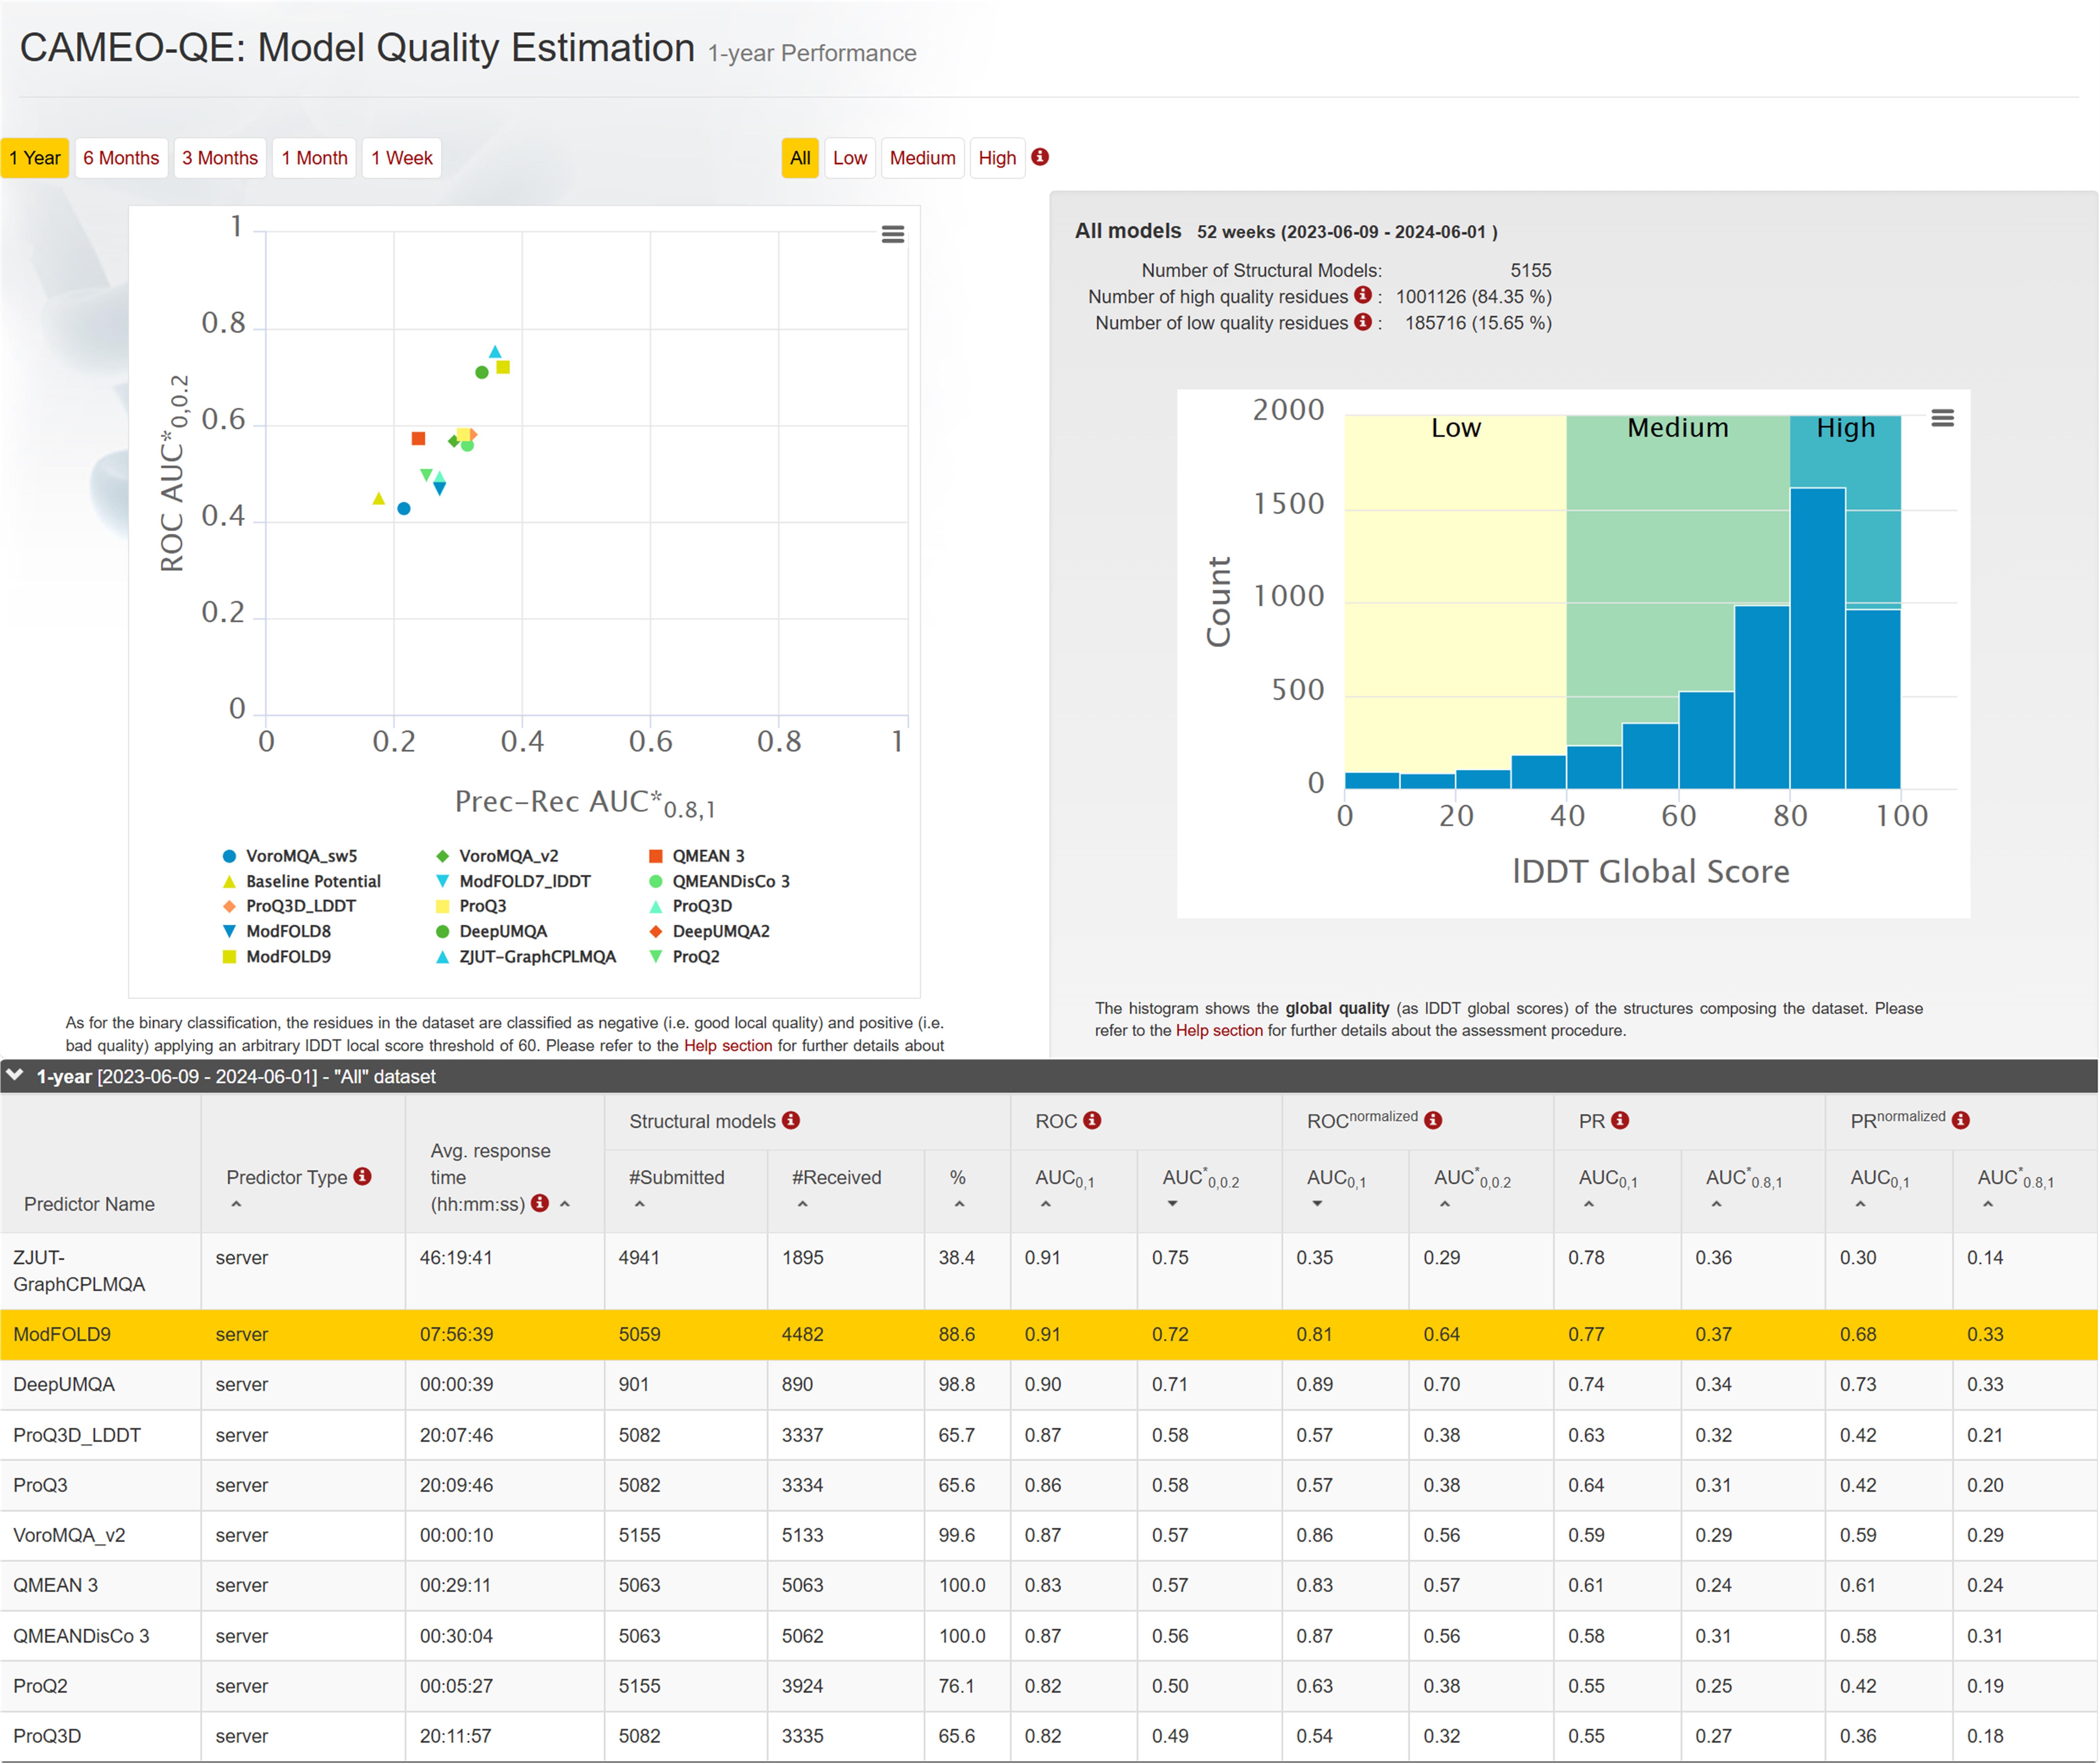 Figure 10. CAMEO 1-year blind test ranking in 'All' dataset.
 Figure 11. CAMEO 1-year blind test ranking in 'Low' dataset.
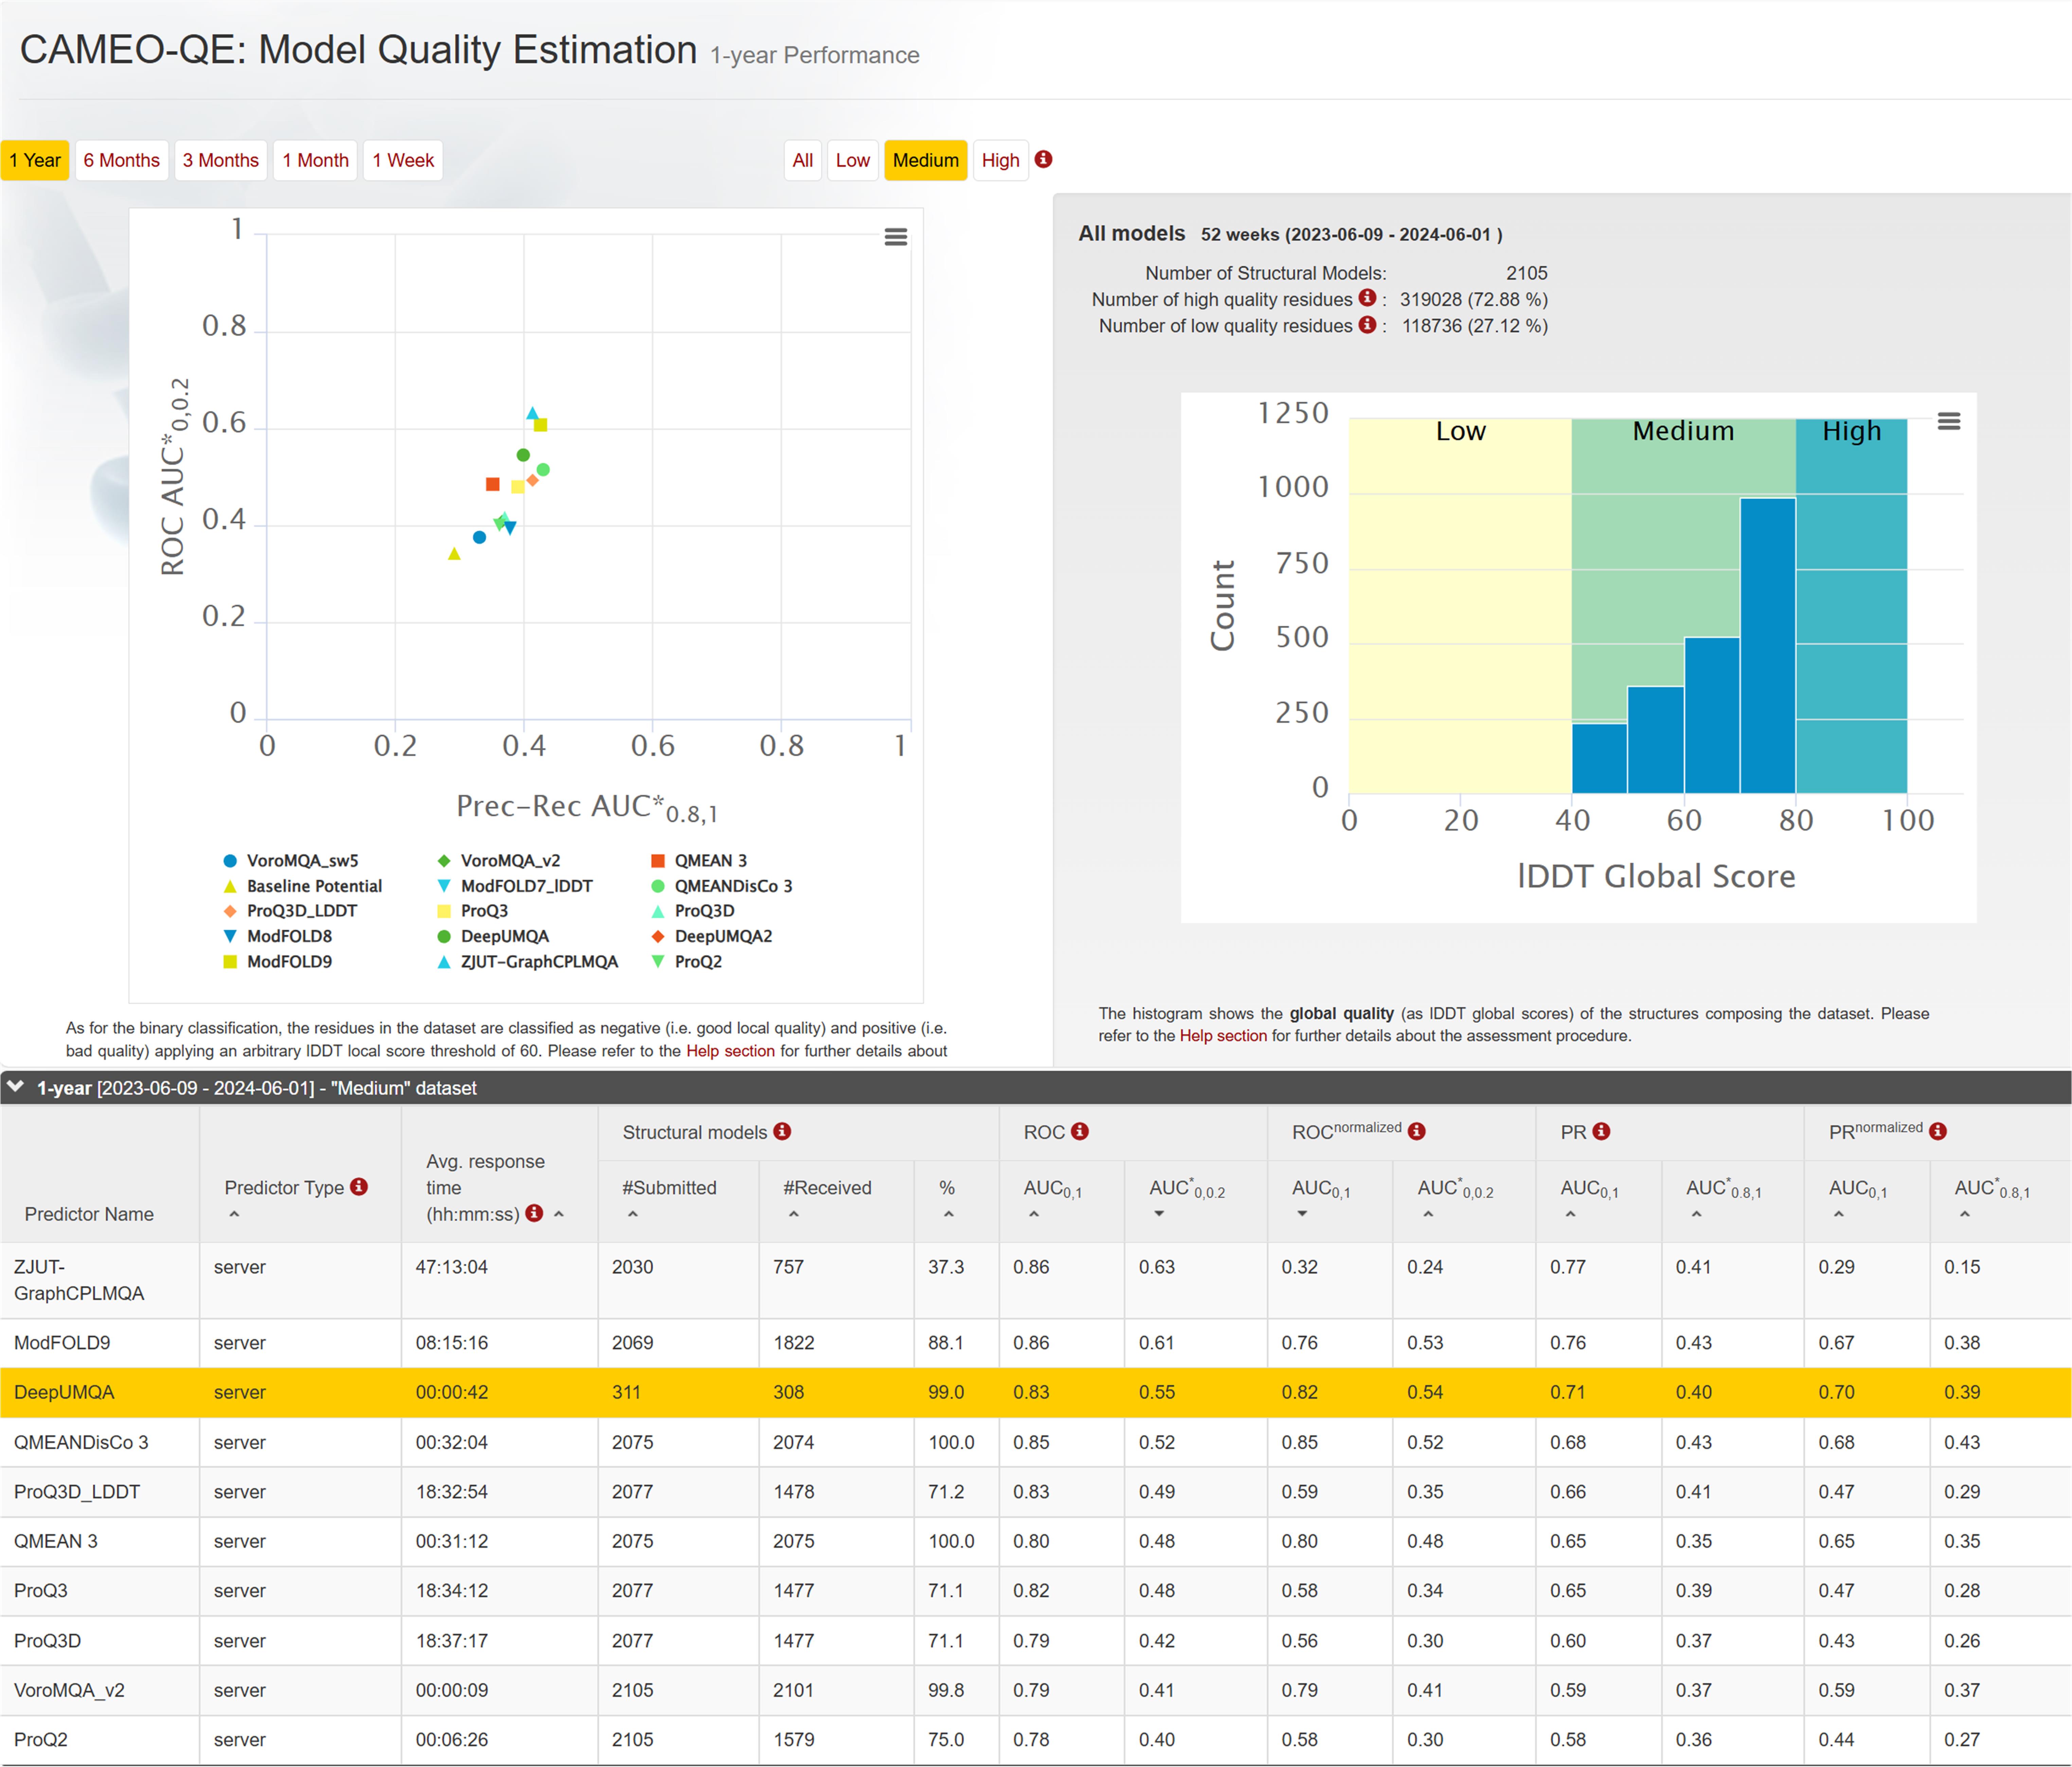 Figure 12. CAMEO 1-year blind test ranking in 'Medium' dataset.
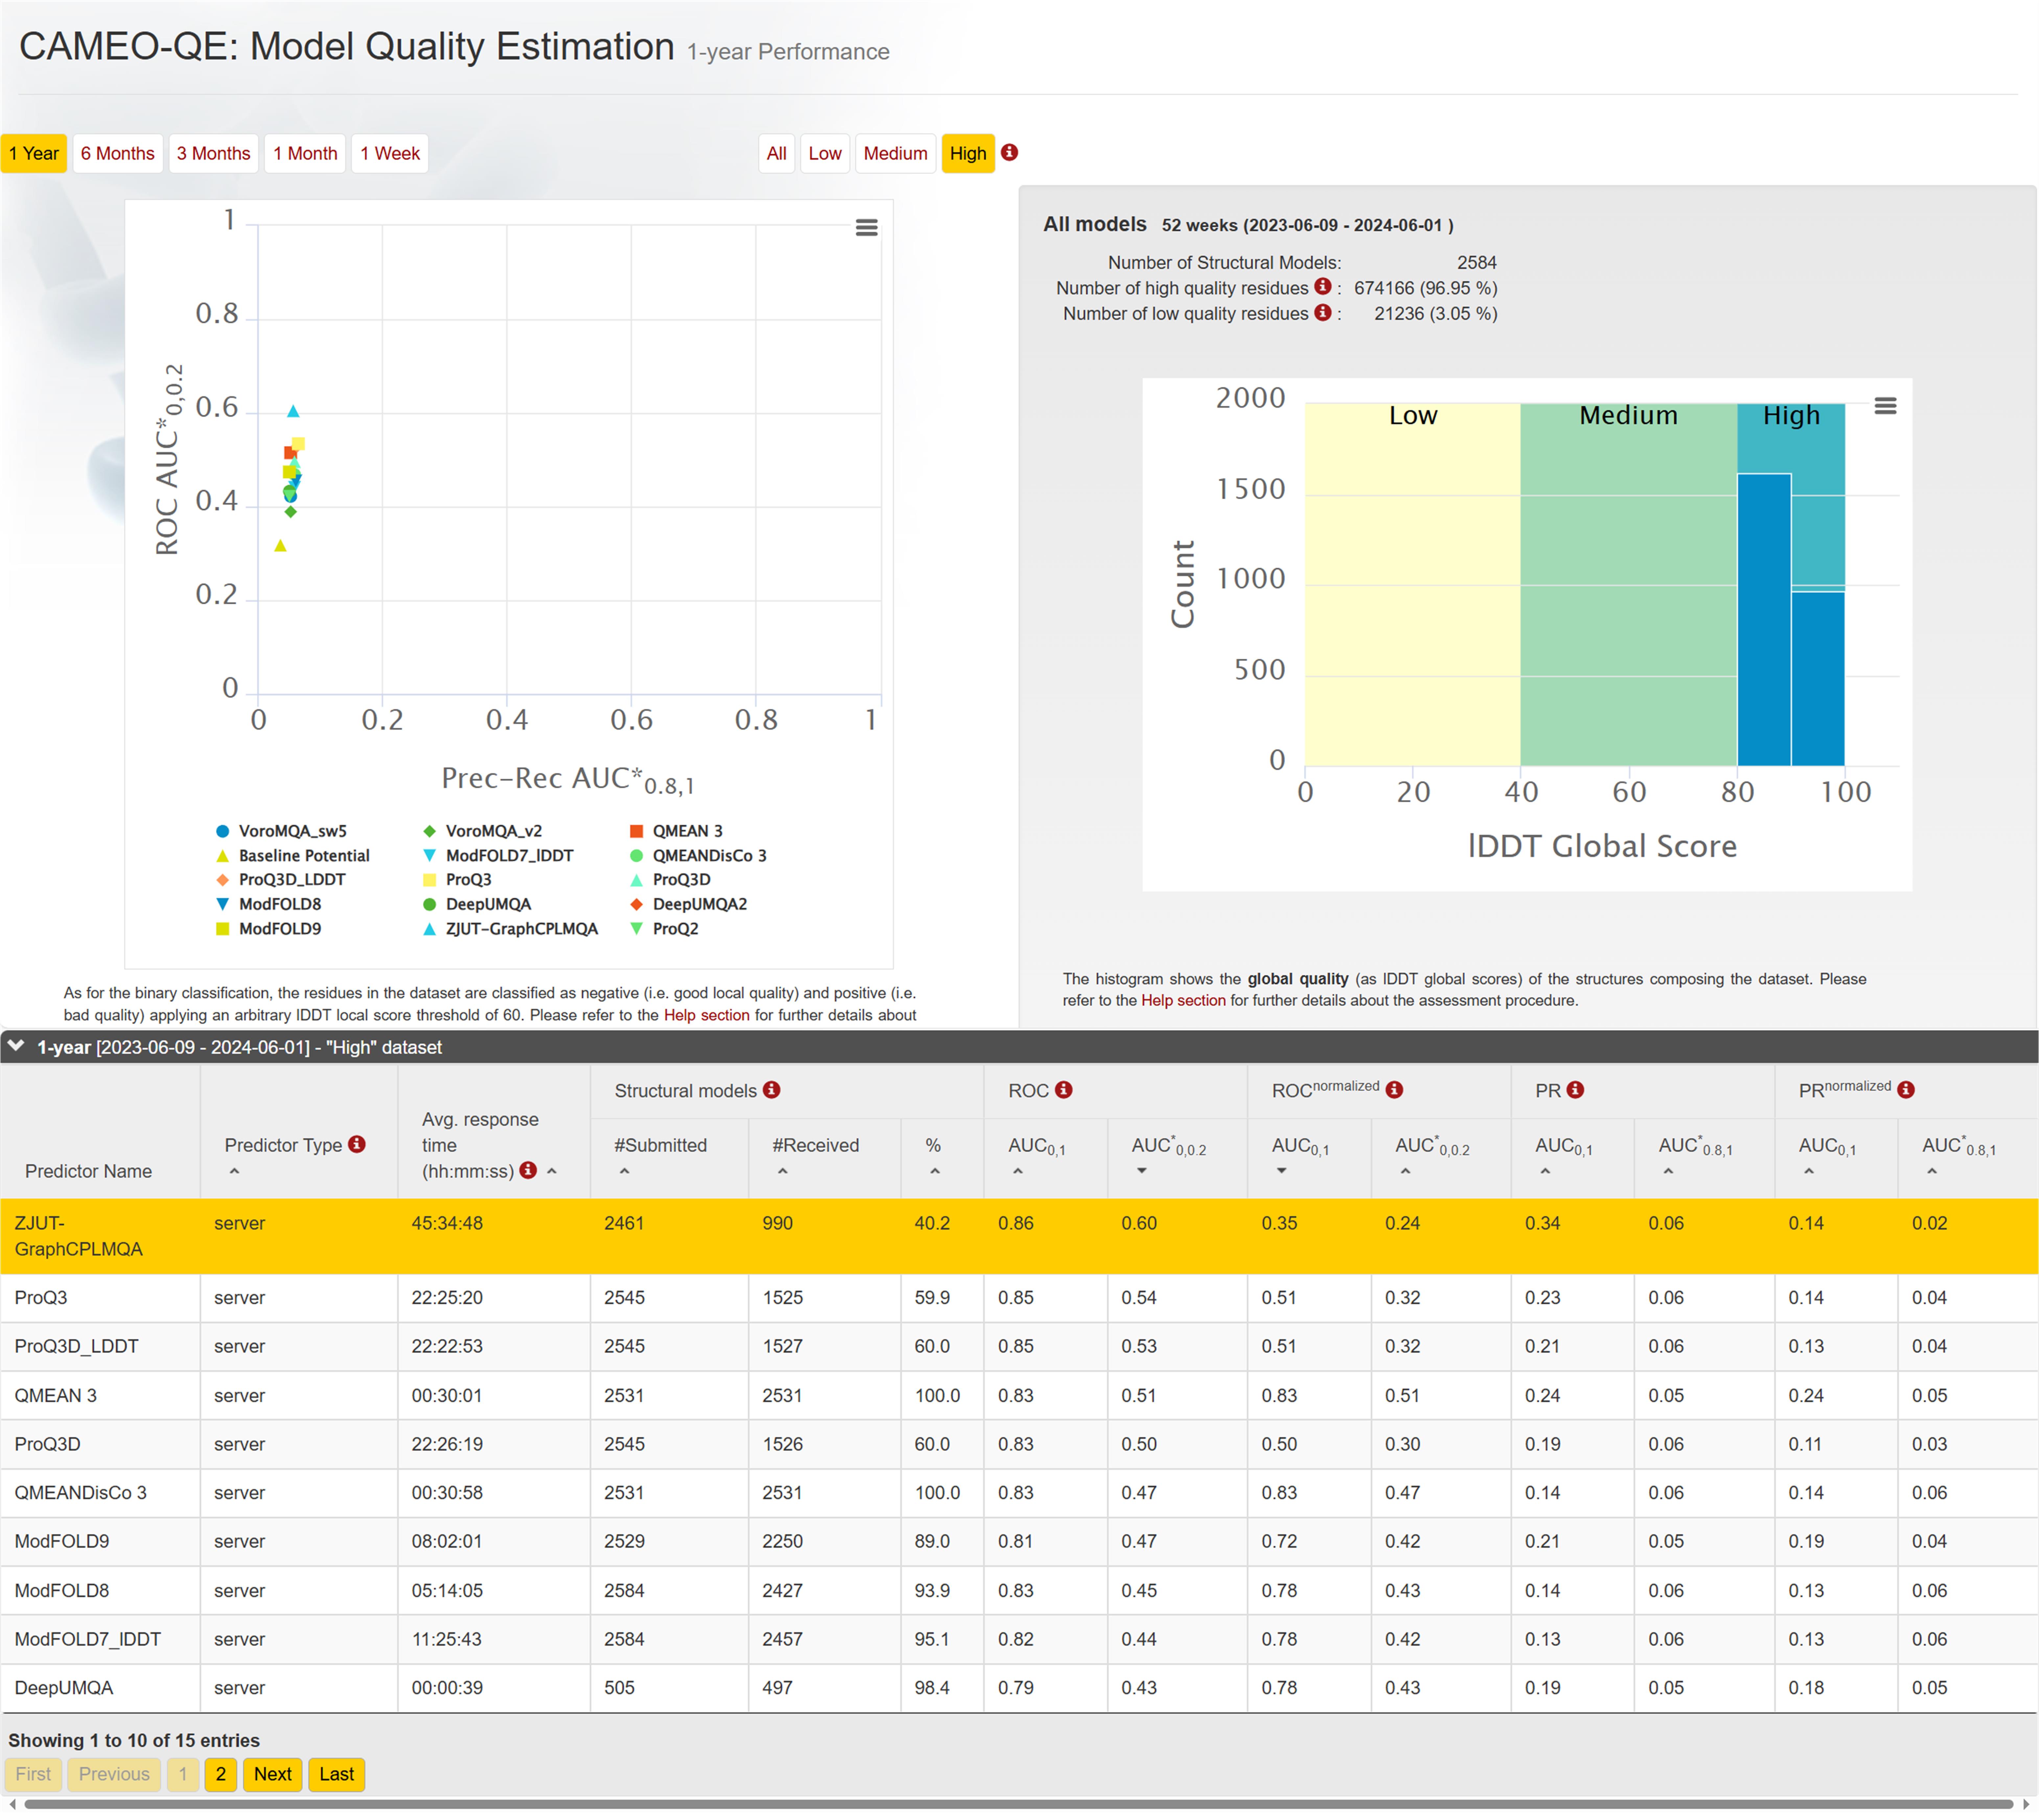 Figure 13. CAMEO 1-year blind test ranking in 'High' dataset.
How to cite DeepUMQA-X?
Please cite the following articles when you use the DeepUMQA-X server:
-
Dong Liu✝, Biao Zhang✝, Jun Liu, Hui Li*, Le Song* and Guijun Zhang*.
GraphCPLMQA: Assessing protein model quality based on deep graph coupled networks using protein language model.
Briefings in Bioinformatics, 2023, 25(1):bbad420.
-
Jun Liu, Kailong Zhao and Guijun Zhang*. Improved model quality assessment using sequence and structural
information by enhanced deep neural networks. Briefings in Bioinformatics, 2023, 24(1): bbac507.
-
Saisai Guo✝, Jun Liu✝, Xiaogen Zhou, Guijun Zhang*.
DeepUMQA: Ultrafast Shape Recognition-based Protein Model Quality Assessment using Deep Learning.
Bioinformatics, 2022, 38(7): 1895-1903.